这一节介绍了一些D3的入门知识,比较琐碎,重点还是D3的练习
还有第一二节的问答题
Lesson 2 可视化和D3基础知识
D3 新版本
D3 v4中的每个符号都共享一个平面名称空间,而不像v3中是嵌套的。
| v3 | v4 |
|---|---|
| d3.scale.linear | d3.scaleLinear |
| d3.layout.treemap | d3.treemap |
加载D3
1 | <script type="text/javascript" src="<d3.v3.min.js的地址>"></script> |
js文件的最小化和丑化
最小化 Minify 去掉不必要的格式符、空白符等
丑化 Uglify 缩短变量名称
Often times the D3 script is aloso surfing a content delivery network (CDN) and this just gives you quick access to the script, so that way your client can download it and make it available for the application.
D3 入门
文档选择器
- JavaScript
document.getElementById/ByName…()
jQuery可以让选择DOM节点十分容易
返回DOM元素 - CSS选择器
document.querySelector(‘.类名’)
返回文档中匹配指定 CSS 选择器的一个元素
返回DOM元素 - D3选择器
返回D3数组对象,可进行D3操作
类选择注意点
- 类名在一个页面上是不唯一的,而id是唯一的
并列选择,可以选择同时具有某些类名的元素
1
2
3<svg class="classA classB"> </svg>
d3.select(".classA.classB")嵌套选择,当目标元素没有类名、id时,可以通过选择父级元素间接选择,以空格隔开
1
2
3
4
5<a id="hi">
<img src="...">
</a>
d3.select("#hi img"). ...
D3链语法
D3 finds and returns a selection and then pass it to the next function.
使用D3可以添加、删除和改变DOM节点
Scale
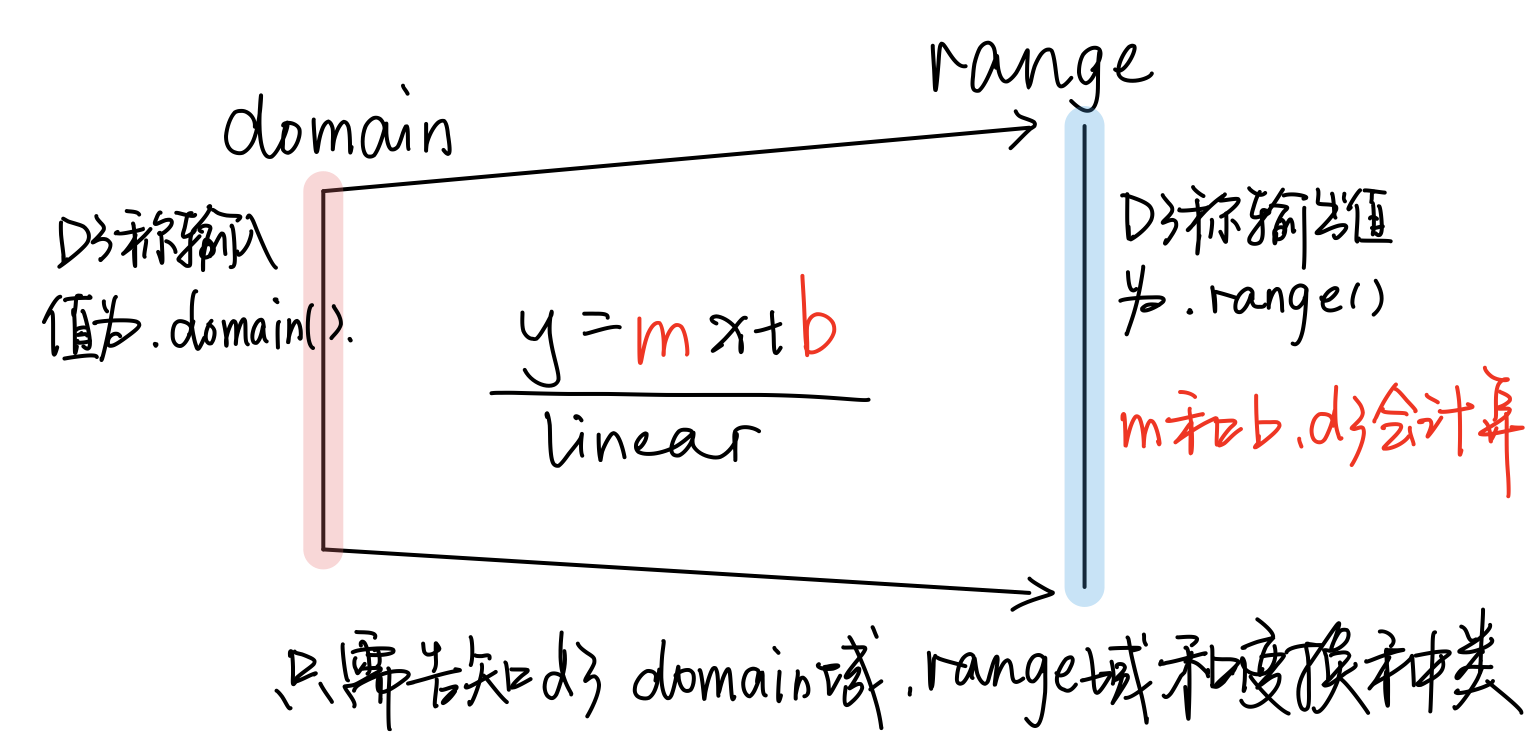
d3.scale.linear().domain([15, 90]).range([250, 0])
注意 用图形来表示数值比较时,注意半径问题——圆性呈现的是所提供数值(半径)的平方级比较,要确保数据的真实性
制作一个柱状图
1 |
|
阅读list
Lesson 3 Exercise for Lesson 1 & 2
Summary statistics can hide patterns and outliers in data sets which is why exploratory plots are helpful for “seeing” data. —- True
Anscombe’s Quartet shows why this is so import
How does data visualization take advantage of human perception?
- Humans can process visual information in parallel (all at once) as opposed to taking in information serially, like when reading text word by word.
- Human eye is excellent at indentifying differences in placement & color
[x] Visual encodings are chosen to be flashy and to grab the reader’s attention.
That’s wrong because the decision to pick up visual encodings shoule not be rely on being eye-catching.