Lesson 7讲了获取数据的途径、叙事结构的种类和用D3.js编程的实例.
Lesson 7 叙事结构
相关性与因果关系
相关性,correlation,A AND B
因果关系,causation,A -> B
A与B具有相关性不意味着它们有相关性。
新新闻主义
更开放,故事是为数据而服务的,媒介通常是动态网页。
传统数据新闻通常是用图表做故事叙述的辅佐,通常是静态网页、报刊杂志等。
获取数据
A Five Minute Field Guide
如何获取想要的数据:
- 精简搜索(Google)
- 搜索时包括数据内容和数据格式 eg: ‘filetype: xls’
- 搜索部分URL eg: ‘inurl: downloads filetype:xls’ 会返回所有在地址中含’downloads’的xls文件
- 不直接搜索内容, 而搜索可能存在目标数据的地方
浏览数据网站或服务机构
Official data portals. The government’s willingness to release a given dataset will vary from country to country. A growing number of countries are launching data portals (inspired by the U.S.’s data.gov and the U.K.’s data.gov.uk) to promote the civic and commercial re-use of government information. An up-to-date, global index of such sites can be found at datacatalogs.org. Another handy site is the Guardian World Government Data, a meta search engine that includes many international government data catalogues.
The Data Hub. A community-driven resource run by the Open Knowledge Foundation that makes it easy to find, share and reuse openly available sources of data, especially in ways that are machine-automated.
ScraperWiki. an online tool to make the process of extracting “useful bits of data easier so they can be reused in other apps, or rummaged through by journalists and researchers.” Most of the scrapers and their databases are public and can be re-used.
The World Bank and United Nations data portals provide high-level indicators for all countries, often for many years in the past.
A number of startups are emerging, that aim to build communities around data sharing and re-sale. This includes Buzzdata — a place to share and collaborate on private and public datasets — and data shops such as Infochimps and DataMarket.
DataCouch — A place to upload, refine, share & visualize your data.
An interesting Google subsidiary, Freebase, provides “an entity graph of people, places and things, built by a community that loves open data.”
Research data. There are numerous national and disciplinary aggregators of research data, such as the UK Data Archive. While there will be lots of data that is free at the point of access, there will also be much data that requires a subscription, or which cannot be reused or redistributed without asking permission first.
利用论坛发问比如getthedata.org或Quora
Getting Data from the Web
如果无法直接获取数据库,可以从网络上收集。
利用图表撒谎
- 柱状图的y轴应从0开始,线图可以不用
- 饼图会有混淆效果,可用堆叠条形图改进,以展示100%的数据意义
- 线图的样本点采用、y轴起点可能会影响数据展示效果
偏差类型
- 作者偏差
利用visual encoding有意无意地篡改数据(图标撒谎) - 数据偏差
产生于数据收集过程 - 读者偏差
读者的先入观念
叙事结构
- Author-Driven Narratives
(常用于传统数据新闻叙述)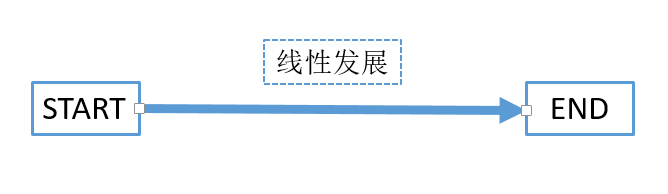
特点:
- strong ordering
- heavy messaging
- need for clarity & speed
- Viewer-Driven Naarratives
常用于新新闻主义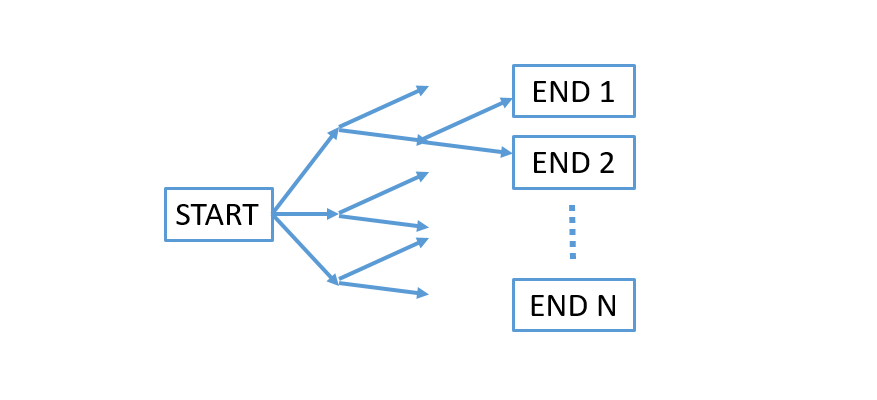
特点:
- viewers ask question on their own
- explore data
- tell their own story
- Martini Glass
更加复杂的Data Visualization,是上述二者的结合,先线性叙述,然后让读者自己探索数据。
揭秘D3.js
绑定数据
1 | d3.select('svg') |
在未进行这段代码之前,selectAll('circle')返回的应该是空集,那么数据绑定到哪了?1
2
3
4
5d3.select('svg') // select a container svg element on the page
.selectAll('circle') // create an empty selection to bind data
.data(data) // bind data to the empty selection
.enter() // select all bound data elements not displayed
.append('circle') // create svg element for the bound data
d3在与空集绑定数据时,会创建虚拟占位符来关联至数据得每一行。
enter() && exit()
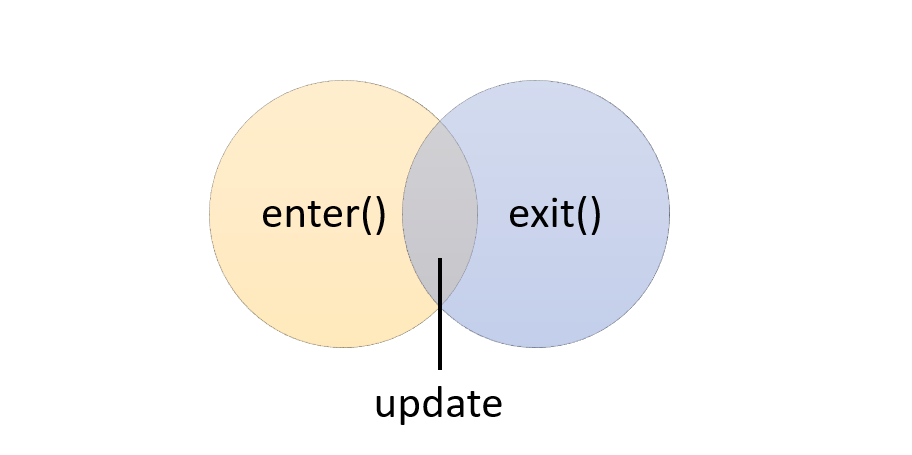
update代表当前存在于html中,之前进行data绑定的元素exit()代表enter()的方面,表示html元素未与数据做绑定。用途:
- 去除不再显示的元素
- 在不同时间点的数据存在变化的动画中使用
- 在初次绘制图表且拥有可供用户选择根据某个类别筛选的子选项时使用
使用D3.js绘制坐标轴
- 定义区间
1
2
3
4
5
6var time_extent = d3.extent(data, function(d) {
return d.date;
});
var count_extent = d3.extent(data, function(d) {
return d.attendance;
})
为了安全,将日期数据转为JavaScript的日期对象,可以使用内置函数进行转换:1
2
3
4format = "..." // 定义格式
d3.tsv("...", function(d) {
d.date = format.parse(d.date);
})
将数据从初始值映射到实际的像素点
1
2
3
4
5
6var time_scale = d3.time.scale()
.range([margin, width])
.domain(time_extent);
var count_scale = d3.scale.linear()
.range([height, margin])
.domain(count_scale);绘制轴
1
2
3
4
5
6
7
8
9
10
11
12
13
14
15
16var time_axis = d3.svg.axis()
.scale(time_scale)
.ticks(d3.time.years, 2);
var count_axis = d3.svg.axis()
.scale(count_scale)
.orient("left"); // 将刻度绘制在轴路径的左边
d3.select('svg')
.append('g')
.attr('class', 'x axis')
.attr('transform', 'translate(0, ' + height + ')')
.call(time_axis)
d3.select('svg')
.append('g')
.attr('class', 'y axis')
.attr('transform', 'translate(' + margin + '0)')
.call(count_axis)
call()将存取对象传递值函数调用链。transform属性用于移动元素(这里是坐标轴)在svg中的位置。
绘制legend
其实还是正常画法,D3.js没有专门的绘制legend的API。1
2
3
4
5
6
7
8
9
10
11
12
13
14
15
16
17
18
19
20
21
22
23
24var legend = svg.append('g')
.attr('class', 'legend')
.attr('transform', 'translate(' + (width - 30) + ',' + 10 +')')
.selectAll('g')
.data(['Home Team', 'Others'])
.enter()
.append('g');
legend.append('circle')
.attr('cy', function(d) {
return 30 * i;
})
.attr('r', function(d) {
if(d == 'Home Team')
return radius * multiplier;
else return radius;
});
legend.append('text')
.attr('y', function(d) {
return i * 30 + 5;
})
.attr('x', radius * 5)
.text(function(d) {
return d;
});
对于text元素来说,x和y定义了开始画文本的左下角的位置.